Model Portfolio Masterclass - Episode 3

Photography by mstandret
The Statistical Properties of Different Asset Classes
Irene Bauer
Algo-Chain, Co-Founder
As a Wealth Manager, have you ever wondered what goes into those model portfolios for your clients? Well, it’s all about the underlying exposures, the different types of investments that make up the portfolio. Each plays a distinct role, from growing the portfolio to protecting it.
Diversification plays a key role in the asset allocation mix and while it might not get you a full free lunch, it should at least give you a starter. We dive into the different asset classes, equities, fixed income, commodities and alternatives, the sub-asset classes of each and their statistical properties.
Listen to the Podcast Series*
Let’s first start with looking into more detail for a select few exposures. In this case we think of a Wealth Manager building a portfolio in USD and what the core assets might be in that portfolio. If we build a portfolio in GBP or EUR or any other currency, the fixed income part is often more tailored to that region, whereas for the equity part we might only have minor differences, often depending on whether one has some home bias or not.
The graph below, called a dendrogram, shows this set of exposures in the form of cluster analysis (Ref 1). Exposures that are highly correlated with each other are formed in one cluster. For example, European and Global Equities form the cluster at the bottom of the graph and are 94% correlated with each other. On the other hand, the equity cluster is on average 65% correlated to any of the fixed income exposures. We have also included Bitcoin in the graph; it is not yet mainstream in model portfolios, but one can see that it is only minimally correlated to any of the other assets.
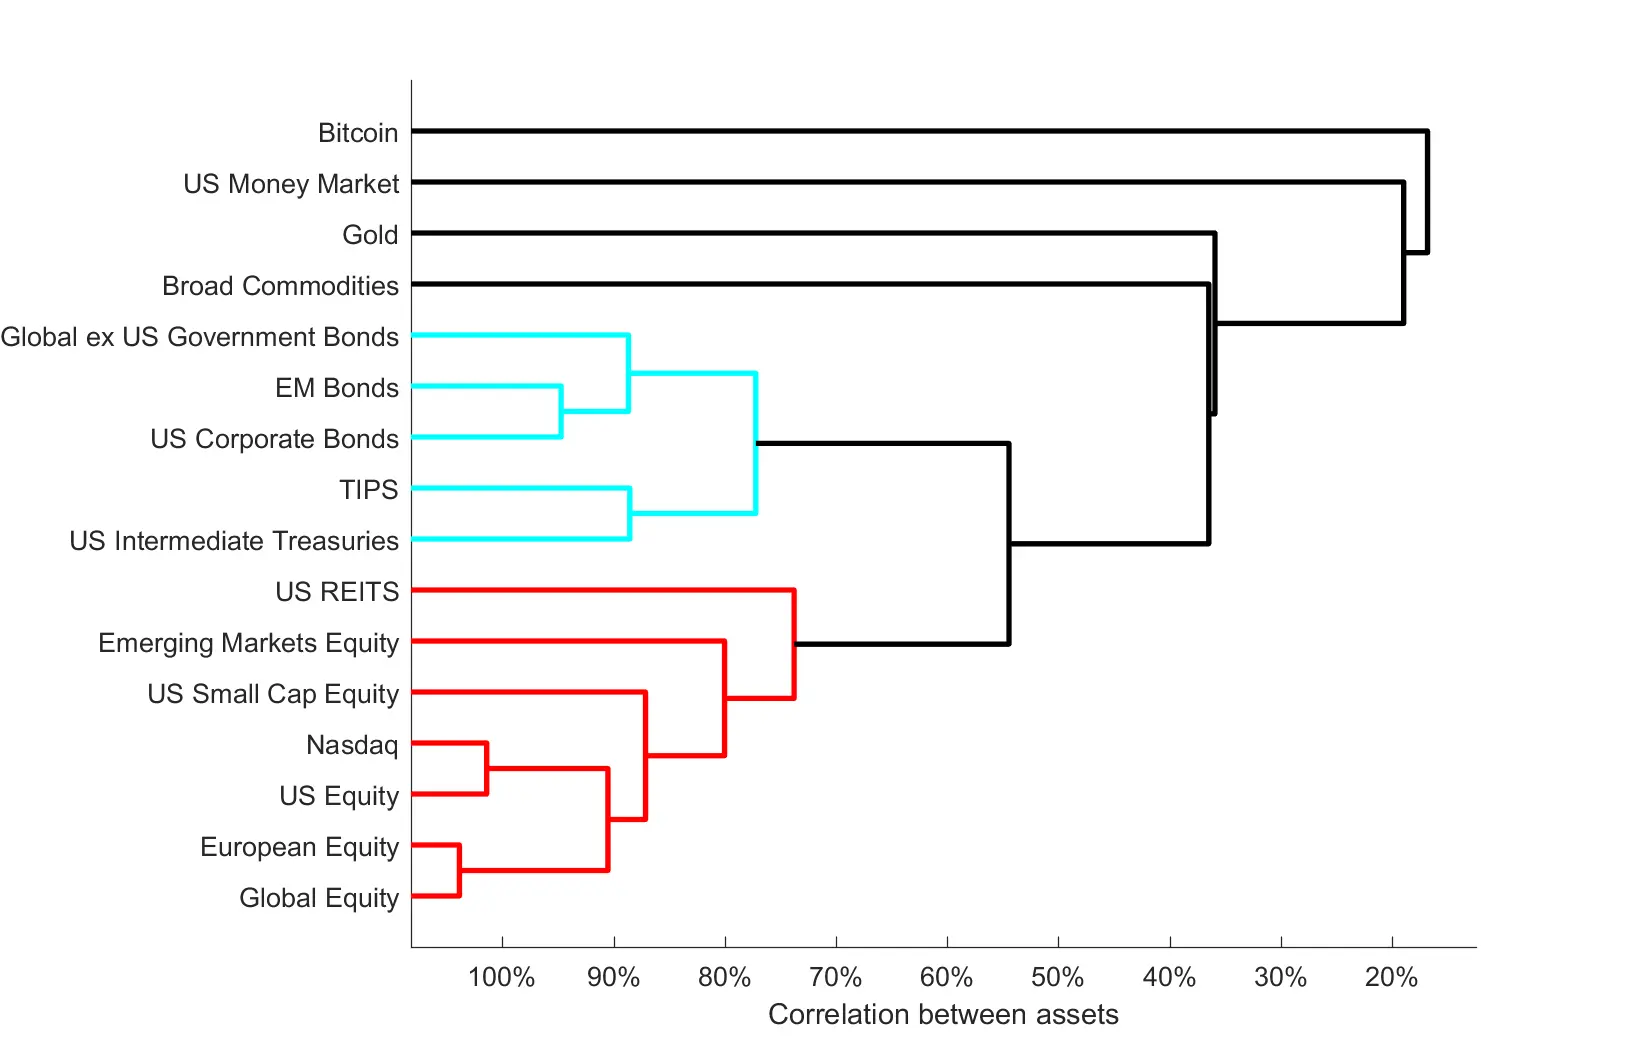
A Dendrogram representation of the joint correlations between asset classes
Cluster analysis is an easy way to showcase correlations between assets. When constructing a portfolio, one would prefer to choose less correlated assets; kind of like choosing one from each cluster. The idea is that when one asset goes down another one, that has a low correlation to the non-performing asset, will hopefully not go down at the same time, thus not putting all our eggs in one basket.
A more typical way of looking at diversification is via a correlation matrix heatmap (Ref 1). The heatmap below uses the same information for the same set of assets as in the dendrogram, just represented in a different way. Again, we can see that Money Market, Gold and Bitcoin are the least correlated to any of the other assets.
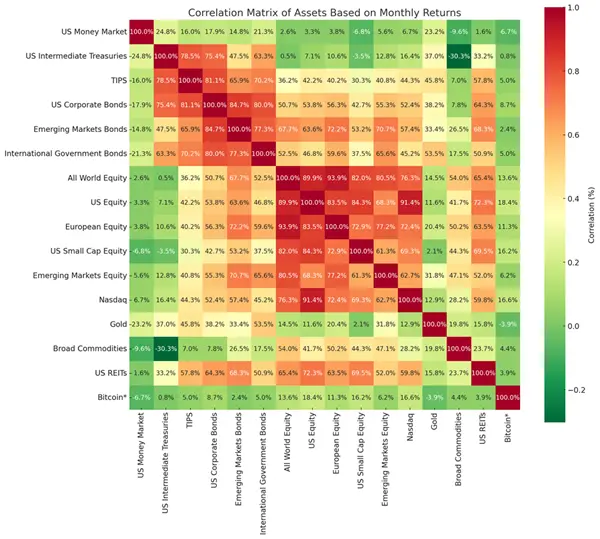
A traditional representation of the joint correlations between asset classes
So, what to do with that knowledge?
Below we go into more detail of average returns and volatility of different asset classes.
Equities: The Growth Engine
Equities can be seen as the risky but rewarding portion of a portfolio. These are shares in companies like Apple, Amazon, and many smaller firms. In general, equities work well during a recovery and expansion phase, but don’t do so well when the economy is slowing down as expected falls in profits will bring the share price down.
There is a vast amount of choice amongst equities: large cap, small cap, US or Europe or Emerging Markets, Value or Growth, specific themes and the list goes on. Also, a specific company, let’s say Nvidia, will have much more idiosyncratic risk than a general market like the S&P 500, which also adds to the diversification.
Let’s look at the statistics for the equities part used in the dendrogram above (Ref 2). In the case here we can have a longer history, which starts from 31 December 2007, so does have the global financial crisis in it, which is a good reminder of what one could loose with any one of these assets.

Statistical properties of Equities
There is quite a difference between the return of these equity assets. As we know, technology stocks and the US in general have done very well over that time and not surprisingly have the largest average annualized returns. What is also interesting are the maximum drawdowns for the different assets. It explains why one would like to add some Fixed Income into the asset mix for a less adventurous portfolio.
Let’s look at that period going into and coming out of the global financial crisis in more detail. Below we show the daily performance of those equity assets from 31 December 2007 to 31 December 2009. The global financial crisis was already boiling in the markets in 2007, but probably the biggest event was the collapse of Lehman Brothers on 14 September 2008 which sent equity markets down much further. By March 2009, when government bailouts and rate cuts fed through the system, equities started to rise again, although it took longer than the end of the year of 2009 to recover back to their previous highs.
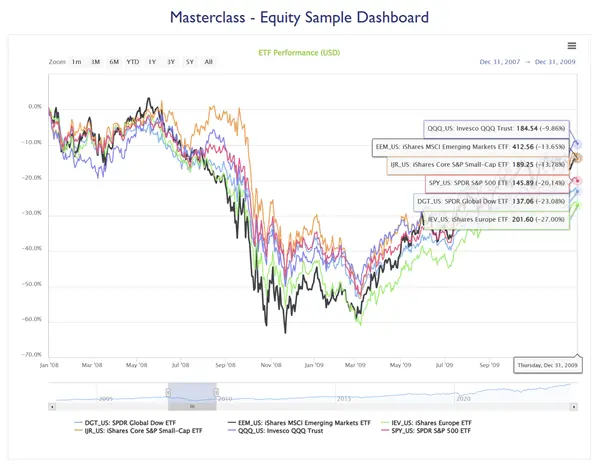
Equity drawdowns during the Global Financial Crisis
Fixed Income: The Safety Net
Bonds are the portfolio’s calm, reliable side – well they used to be until the drama of 2022 when the Fed put up interest rates multiple times. Essentially, at the risk of over simplification, one is lending money to a company or government in exchange for interest payments. Let’s not forget, there are even more different types of exposures in fixed income than in equities: government bonds, inflation-linked, corporate bonds of different risk ratings, and asset-backed securities are the different types of exposures, then one can have any of these exposures at different maturity levels – short-, medium- or long-term – and there are also different regional exposures.
During an expansion phase, when the economy is booming and rates are more likely to go up, lower credit risk investments like investment grade and high yield corporate bonds are often the better performers. During a slowdown and downturn of the economy, these investments may go down if markets expect more defaults to happen. In this case rates are often coming down and longer maturity bonds of higher credit levels, like Treasuries, are a good investment.
That’s why bonds can add stability to a portfolio. When the stock market is on a rollercoaster, bonds often help smooth things out. Take it as read though, it isn’t always as simple as that. As suggested, bonds should come with caution, as lately long-term Treasuries could have lost you more than equities. As an example, the Vanguard Extended Duration Treasury ETF (EDV US), an ETF with 20 to 30-year maturity Treasuries, had a maximum drawdown of nearly 60% from August 2020 to October 2023. Not quite as boring as it seems. Just think how a leveraged version of this behaved.
For the Fixed Income assets in our correlation statistics, the returns, volatility and maximum drawdown are more tempered. Cash in the form of money market funds, is the simplest asset class – money in the bank or in low-risk, short-term investments like Treasury bills with up to a 1-year maturity. It won’t make you rich but shows a very steady return with not much volatility. When short-term rates are high, as in the most recent years, it gives you a steady income stream. In a low rate environment, cash and money market funds are probably only used in a very low risk portfolio and for that small cash bucket that is often needed on a model portfolio platform (often around 2%). The latter is often required so that the platform is able to deal with any small cash amounts in individual investors’ portfolios, like fees. Any dividend payments may also be kept in the cash bucket until the next rebalancing.
As one increases the credit risk level, for example for corporate and Emerging Markets bonds, the volatility goes up together with the maximum drawdown.
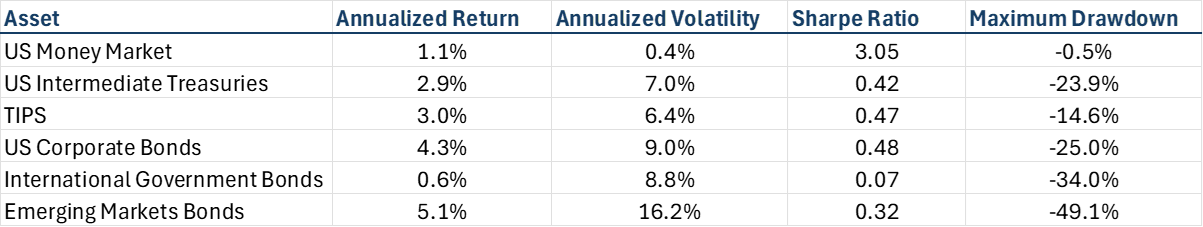
Statistical properties of Bonds
This is also clearly seen in the graph below, where we show these assets again for the period from end 2007 to end 2009. Short- and medium-term Treasuries are rising from the collapse of Lehman Brothers onwards – although to be fair, the rise in money market is very small as rates had been very low at the time – but the other, more riskier assets are falling first and then regaining what they have lost and more by the end of 2009.
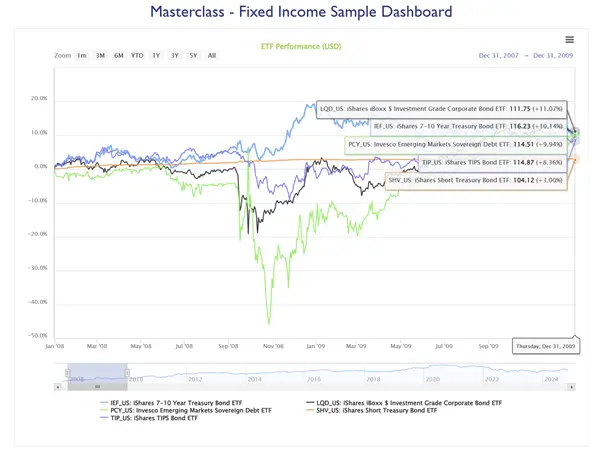
Fixed Income drawdowns during the Global Financial Crisis
Commodities: Tangible Investments
Commodities are physical goods – like gold, oil, or even agricultural products like wheat. They offer a way to diversify away from the traditional stock-and-bond world. Most of gold’s exposure is used within the jewelry industry, but it is also seen as a safe haven in times of market turbulence.
Commodities can provide protection when inflation rises or markets get volatile. They add diversification, but they’re not for everyone because their prices can be unpredictable. Funds with exposure to precious metals often hold the physical underlying, but most commodities can only be invested in via futures, exposing the investor to backwardation and contango.

Statistical properties of Commodities
It is interesting to see that gold, the safe haven asset, had a large maximum drawdown as well, although it was not during the global financial crisis, when equities had their bad moments. The other thing to note is that despite quite some inflation for the period from end 2007 until now, broad commodities earned you nearly nothing over that time. Part of this is due to backwardation and contango.
When we look at the graph below for commodities' performance returns from end 2007 to end 2009, one can see that while gold did go up first in September 2008, it lost its gains again fairly shortly, only to then recover until the end of 2009. General commodities though had their worst time in 2007 with inflation low and economies slowing down.
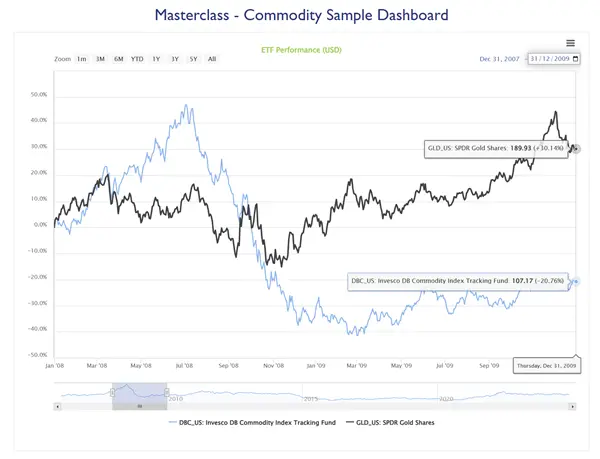
Commodity drawdowns during the Global Financial Crisis
Alternatives: Tangible Wealth Builders or the Wild Card
Alternative investments can include property, hedge funds, private equity, crypto currencies and more. These are less traditional assets and can offer higher returns – but with higher risks, too. They are not always affected by the same factors that drive the stock market, making it great diversifiers.
With property, you’re not buying houses, but rather investing in Real Estate Investment Trusts (REITs), which are like stock market versions of property ownership. REITs own and operate income-generating real estate, like shopping malls, apartments, or office buildings, often with some leverage. It’s a tangible asset that can generate regular income through rent.

Statistical properties of Alternatives
Looking at the REITS sector for the period around the global financial crisis from end 2007 to end 2009, US REITS, being the main origin for the crisis in the first place, went more or less in free fall towards the end of 2008, which we can also see in the maximum drawdown of nearly 70%. They did recover somewhat from March 2009 onwards, but it took them until May 2011 to fully recover back to their previous high, more than two years later.nd 2009, one can see that while gold did go up first in September 2008, it lost its gains again fairly shortly, only to then recover until the end of 2009. General commodities though had their worst time in 2007 with inflation low and economies slowing down.
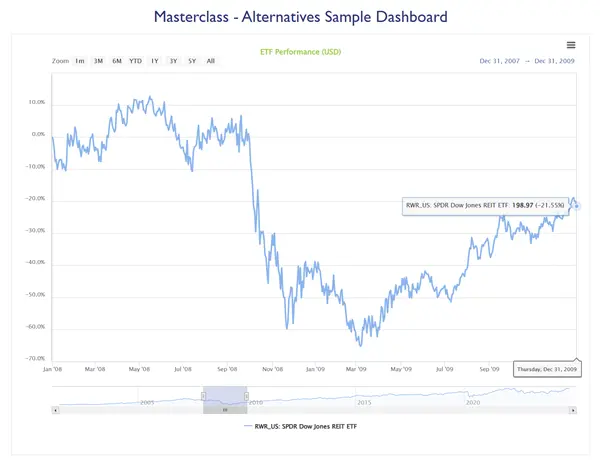
REITs drawdowns during the Global Financial Crisis
Cryptos only started in 2009 with Bitcoin being the first one. They are the most volatile among the alternatives sector, with annualized volatility for Bitcoin at around 80%. Compare that to something around 20% for equities or 7% for medium-term Treasuries. And the maximum drawdown of more than 90% will get many an investor’s heart racing. Bitcoin can be seen as an enabler for international payments, although some question its intrinsic value. Ethereum on the other hand (and many other cryptos) has an intrinsic value behind it, as a lot of Blockchain apps are based on it and it generates money for each use of the software.
How They All Fit Together
Asset allocation is one of the main drivers of returns in model portfolios. In the long term, each and every asset is assumed to go up, otherwise nobody would be interested in investing in it. Diversification is key when trying to achieve good risk adjusted returns and a good model portfolio will combine the different asset classes to meet investors’ financial goals. Younger investors might go heavy on stocks for growth, while retirees might lean more on bonds for safety. The magic is in the mix, and each asset class plays a role in balancing risk and reward. Adding smaller amounts of some of the riskier assets can still add some diversification and provide higher risk-adjusted returns.
A word of caution to the statistics above. Correlations change over time, as do average returns and volatility. If we face another global financial crisis even the maximum drawdowns might change. That’s why one will go back to the statistics again and again and at times might go over- and underweight certain asset and sub-asset classes. This is where the skill of a portfolio manager lies. Don’t expect that they will always get it right, if they are right more often than not, on average that should give that portfolio an edge.
Source: All data and analytics provided by Algo-Chain.
1): Based on monthly data from 31 Dec 2011 to 31 Oct 2024 in USD, all exposures represented via ETFs, except Bitcoin, where it is represented via an ETF, which is backfilled with the Bitcoin price.
2): Based on daily data from 31 Dec 2007 to 31 Oct 2024 in USD, all exposures represented via ETFs, except Bitcoin, where it is represented via an ETF, which is backfilled with the Bitcoin price, and the data is from 31 Dec 2011 to 31 Oct 2024.
Disclaimer
*The podcast provided by Allan Lane & Irene Bauer has been converted from their own original content, into a podcast using Generative AI tools and the voices used in the podcast are not their own. All information provided has been fact checked.
The investments referred to in this podcast is targeted at professional Wealth Managers & Financial Advisors and may not be suitable for all investors. Twenty20 Solutions Ltd does not provide, and nothing in this podcast should be construed as, investment or other advice. It is not intended that anything stated in this podcast should be construed as an offer, or invitation to treat, or inducement for you to engage in any investment activity. The information in this podcast relating to model portfolios & individual funds suggested by Algo-Chain is purely for research and educational purposes only.