Model Portfolio Masterclass - Episode 5

Photography by GStocksStudio
The Use of Trading Signals in Portfolio Construction
Irene Bauer
Algo-Chain, Co-Founder
Introduction
Portfolio construction is an intricate process that demands a comprehensive understanding of financial markets, investment theories, and quantitative methodologies to achieve an optimal risk-return balance. In the previous edition we looked at strategic asset allocation and used the average long-term returns as return forecasts for the mean-variance optimizer. Once we have come up with our strategic asset allocation model, we may want to apply signals to each of the assets to be able to get a slightly more accurate return forecast. This will allow us to decide whether to go over- or underweight those assets and potentially to also determine whether to allocate to a certain asset in the first place. We will go into more detail on tactical asset allocation in the next episode, this article is just looking at the use of signals.
Listen to the Podcast Series*
The application of systematic signals has gained substantial traction among asset managers and financial advisors, serving as a key tool for guiding portfolio decisions. Signals provide structured insights that aim to enhance returns and manage risk more effectively. Two prominent types of signals employed in portfolio construction are momentum signals and economic regime signals, which we will study in more detail. This article delves into the theoretical foundations and practical applications of these signals in portfolio management.
Investment Signals: A Conceptual Overview
Investment signals are systematic indicators derived from financial or macroeconomic data that inform asset allocation, security selection, and risk management decisions. These signals offer data-driven, objective insights that help portfolio managers navigate market dynamics efficiently. Signals are either endogenic, meaning they only use internal data like historical return trends, or exogenic, using additional data like macroeconomic variables and other quantitative factors.
The use of signals allows investors to transition from intuition-based strategies to systematic, evidence-based portfolio management. By leveraging such signals, investors aim to exploit market trends and ultimately enhance the risk-adjusted performance of their portfolios.
Trend-Following Signals in Portfolio Construction
Momentum is one of the most studied and applied factors in finance. Jessie Livermore was the first one to use momentum trading strategies in the late 19th, early 20th century and was very successful with it. Likewise, in the 1980s, the Turtle traders became famous for being able to learn momentum strategies from scratch without previous qualifications - don’t-forget to check out our accompanying podcast series to learn more about the momentum strategies of Jessie Livermore, the Turtle traders and others.
Momentum is a clear phenomenon in markets. Prices of a certain asset go up and more people invest in that asset because it has gone up and so the trend carries on. Until news comes out in the form of new earnings, changes in a certain market or economy or even just some rumours and the price might go in the other direction. When one observes daily returns of an asset, there are usually trends forming at different time horizons – a fast period that fluctuates every few days, a medium period that fluctuates every few months and then the very long period that usually goes hand in hand with the recovery and the downturn of an economy. Day traders usually work on the fast horizon, whereas for model portfolios one would typically work over an intermediate to long-term horizon, such as one to twelve months.
Empirical evidence strongly supports the existence of the momentum effect, making it a foundational element in signal-based investing. By incorporating momentum signals, portfolio managers can overweight assets demonstrating positive price momentum and underweight those exhibiting negative momentum, with the objective of capitalizing on trends and generating superior returns.
Momentum Signals
Momentum investing exploits behavioural biases such as investor herding and overreaction to news, allowing systematic strategies to generate alpha by capturing extended trends. However, momentum strategies are susceptible to sharp reversals during volatile periods, which may result in significant drawdowns. Effective risk management, potentially through complementary signals like economic regimes, is crucial to the successful application of momentum.
There are many different momentum signals used in the markets. These range from moving averages, like taking the return over a certain horizon, 3, 6 or 12 months say, crossing moving averages like MACD (Moving Average Convergence/Divergence) or z-scored momentum, which equals (x – µ) / σ
The z-scored momentum signal shows how far the current value deviates from its mean, normalised by the standard deviation of its historical returns. In its simplest form, x is the latest value (in this case return), µ the average of the values x and σ the volatility of them. One can also use exponential smoothing with a certain half-life, h, where a value of h days in the past has half the weight compared to the latest value and one 2h days away has a weight of one quarter compared to the latest weight. To have a smoother momentum signal, one might also smooth the original values first and then arrive at µ and σ of the smoothed values. In order to remove outliers, the signal is winsorized, i.e. capped at a certain value. In our case we cap it at ± 2, with a negative value showing bearish predictions, meaning in a long-only portfolio one might want to get out of that asset or reduce the weight. And likewise, with a positive value for an asset, one might want to increase the weight.
Typically, for a monthly or quarterly rebalancing one might use a smoothing with a half life of 1 or 2 years. This seems quite a slow signal, but evidence shows that the slower smoothing is often better as the portfolio will not try to chase changes in trends with much faster periodicity.
Momentum strategies can be applied across asset classes, including equities, bonds, alternatives and commodities, thus providing a versatile tool for diversified portfolios. The drawback of momentum signals is that they are not capturing turn of markets that quickly. Therefore, we want to combine this signal with others.
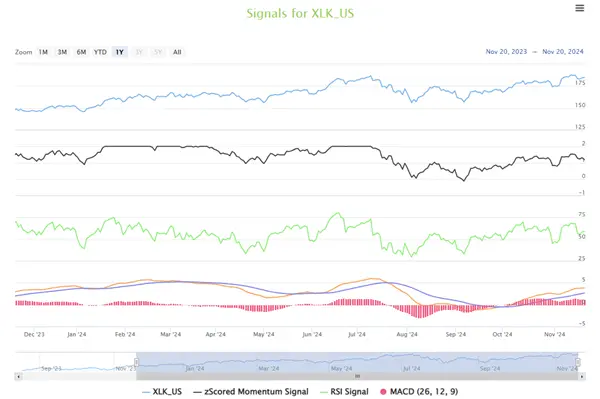
Different trend-following signals for the Technology Select Sector SPDR ETF (XLK)
Economic Regime Signals
Economic regime signals represent a macroeconomic framework where we adjust the asset allocation in response to prevailing economic conditions. The economic cycle is often categorized into four distinct regimes – expansion, contraction, recession, and recovery – each associated with unique asset class behaviours. By identifying the current economic regime, portfolio managers can tailor asset allocations to align with the macroeconomic outlook, thereby enhancing risk-adjusted returns.
Typical examples of macroeconomic data used are forward looking indicators that give an early sign of changes in the markets. These include business and consumer confidence, forward looking estimates of GDP growth, and changes in employment status and wages. These indicators are often characterised by early changes in any of the measures.
Form these early indicators, we analyse and aggregate the data and translate it into four economic regimes. Different asset classes on average behave very differently during the economic cycle. For example, equities, particularly cyclicals, are usually positive in an expansion phase, still positive but slowing down in a downturn phase, often going sidewards or negative in a slowdown phase and really rallying when the economy finally turns during a recovery. The opposite is often true for Treasuries and other lower risk Fixed Income assets, although longer-term Treasuries can show quite negative returns in a rate rising environment, as we have seen in the 2022/23 period. We exploit the different phases of the economic regime to invest in different types of assets given the current regime we are in.
The graph below shows the average annualized return for each of the economic regimes and for the overall period from 31 Dec 2002 to 31 Oct 2024 in USD. As expected, equities have the highest returns in a recovery and expansion phase, whereas their worst returns are in a slowdown. Government bonds on the other hand perform best during a downturn, when rates are starting to come down. Gold works best in a slowdown, but not very well in an expansion phase.
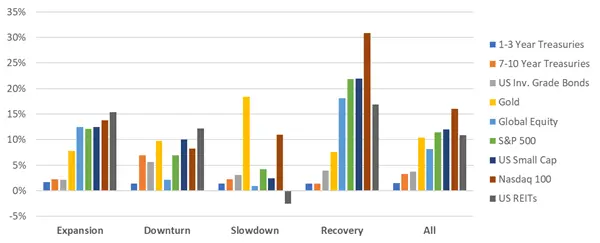
Average annualized returns per economic regime (See Ref 1)
To highlight the point even better, we look at the Sharpe Ratios of average returns over the four different economic regimes. What it clearly shows is that equities are the best investments from a return per level of risk investment point of view during a recovery phase. During the later stages of the rally (expansion phase) this is still not a bad investment, but it clearly changes during a slowdown where one can often receive higher returns per level of risk from lower risk assets. Within fixed income, not surprisingly, short-term Treasuries are always the best from a Sharpe Ratio point of view, but they do not provide very high returns. In a slowdown phase, Treasuries and other lower risk assets demonstrate the better investments, with many equities on average returning negative results.
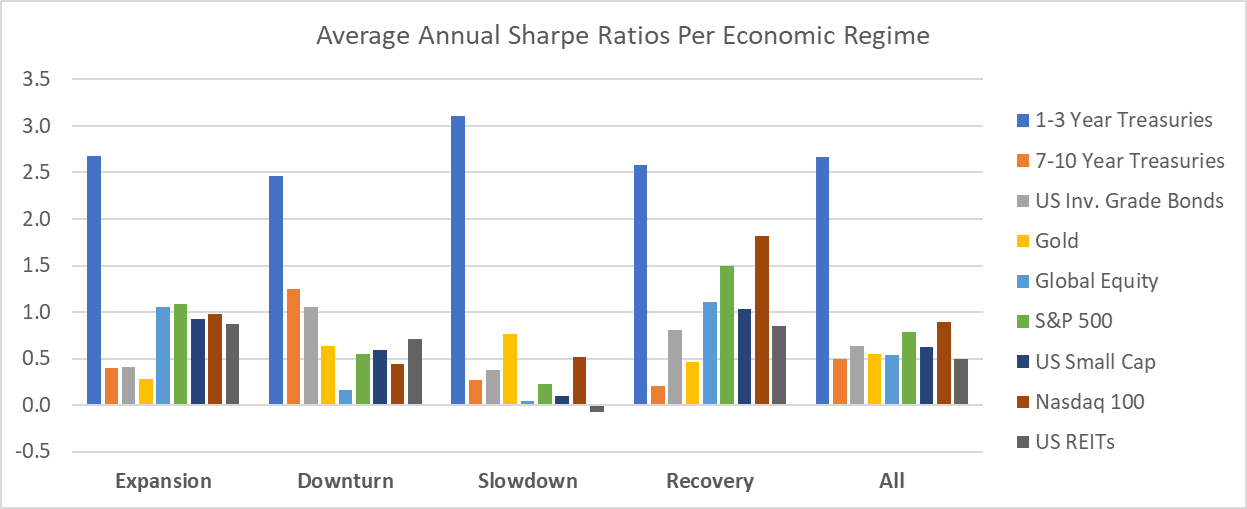
Average Sharpe Ratios per economic regime (See Ref 1)
It is interesting to see that gold, the safe haven asset, had a large maximum drawdown as well, although it was not during the global financial crisis, when equities had their bad moments. The other thing to note is that despite quite some inflation for the period from end 2007 until now, broad commodities earned you nearly nothing over that time. Part of this is due to backwardation and contango.
The advantage of economic regime signals lies in their forward-looking nature. Rather than being reactive to market movements, regime-based allocation is proactive, leveraging macroeconomic indicators to position portfolios advantageously. However, accurately identifying economic regimes is inherently challenging and subject to data limitations, which may lead to misclassifications that negatively impact performance. Also, even though these signals are forward-looking, they do tend to lag what is actually happening in the market today.
The next two diagrams show an example of the macro-economic signals for different UK assets. In this particular study, fixed income is at the top of the list, with signal values ranging from 2 to 0.66. Equities are at the bottom with signal values around 0, showing a neutral stance.
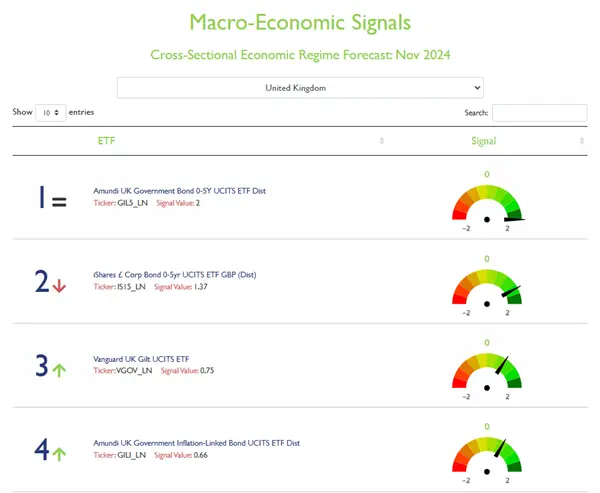
Top 4 macro-economic signals for UK assets
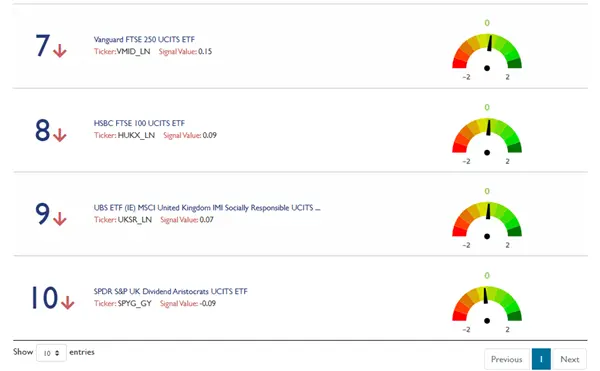
Bottom 4 macro-economic signals for UK assets
Additional Signals
The momentum and economic regime signals work for all asset classes – although one might stop short of applying the economic regime signal for example to crypto currencies. There are other signals that one might want to add into the mix, like a signal that shows when there is heightened uncertainty in risky assets like stocks. This could be a signal based on the VIX or the VStoxx, indices that measure the implied volatility of the S&P 500 and the Euro Stoxx 50, respectively, from options on those indices. When the value of the index is high, the likelihood of the market going down subsequently is higher, although quite often there can be a false storm. One can also look at heightened risk in the markets in general, for example using different asset classes and monitoring when volatility and correlations go up. In general, these signals work, but if you reduce your exposure to risky assets every time there is an elevated risk in the markets, it may reduce your overall performance.
Other signal examples are using credit spreads from CDX and iTraxx to get a slightly earlier indication of changes in corporate bonds than from the price returns. As ETFs become more liquid in the markets, there isn’t a huge gain on this approach anymore. One might also build a specific signal for inflation-linked bonds, adding early indicators of inflation to the signal.
Then there are factor-based signals for equities, using fundamental data of the underlying companies. These are most commonly used for stock selection but can also be used for general indices. During higher risk in the markets, one might want to go overweight exposures that have a value or quality tilt, whereas during a market rally going overweight growth stocks is more favourable.
And of course, there is the latest batch of signals using machine learning and AI. One might use signals based on sentiment analysis, or general signals using some of the deep learning algorithms, which may make use of just the historical price data or several different sources of data.
Testing of Signals
Before using any of the signals for portfolio construction, a rigorous statistical analysis of those signals is paramount. One can first look at statistics between the forecast values and the actual subsequent returns. These statistics might include the hit ratio – how often did the signal show the right sign for the returns, as opposed to getting it wrong? Is the hit ratio better when predicting positive returns or for negative returns? If the former is better, at least it is more often right when we want to overweight a specific asset. If it predicts negative returns too often, which then do not happen, we might just be a bit more cautious in our allocations, which can be okay for more cautious investors and if we invest in many assets which aren’t too highly correlated with each other. What is the correlation between the forecast and the subsequent return? Do not expect a very high correlation, there might even be some correlations that are below zero. These are all part and parcel of what will constitute the first set of tests.
If we are satisfied with those tests, we can backtest the signals in a simulation context, meaning we test how a tactical asset allocation would have performed over time, both in and out of sample. A good way to benchmark if the signals are improving returns is to test that against investing in a fixed weight portfolio. These tests can be done in several currencies and at different risk levels in order to steer clear from data mining as much as possible.
Integrating Several Signals
While momentum and economic regime signals are valuable individually, their combined application yields a more comprehensive portfolio strategy. By integrating these signals, portfolio managers can capitalize on asset trends while adapting to shifts in macroeconomic conditions, thereby optimizing both return generation and risk management. Combining the two signals allows one to not rely on any one signal individually during times when one might not perform at its best. To be able to blend several signals, we first normalize each of the signals, to then be able to blend them together.
And a word of warning, these signals will never give the perfect forecast for the returns over the next one or three months. They are better seen as indications of being bearish, neutral or bullish and variations of that.
Risk Management Considerations
While momentum and economic regime signals present opportunities for enhanced returns, they also introduce specific risks. Momentum strategies are inherently vulnerable to sudden market reversals, which can result in significant drawdowns. Economic regime signals, by contrast, carry the risk of misclassification—if the prevailing economic regime is incorrectly identified, resulting portfolio adjustments may be suboptimal.
To mitigate these risks, robust risk management practices are essential. Diversification across multiple asset classes and signals reduces dependency on any single indicator and minimizes exposure to incorrect signals. Position sizing is another critical tool, ensuring that no individual asset or strategy dominates the portfolio, thereby limiting the impact of adverse outcomes. Additionally, stop-loss mechanisms can serve as an effective means to limit downside risk, particularly in momentum-driven allocations.
Periodic review and rebalancing are also crucial components of risk management. Given the dynamic nature of financial markets, signals should be continually assessed, and adjustments should be made as new information becomes available. A disciplined rebalancing strategy ensures that portfolios remain aligned with both strategic objectives and evolving market conditions.
Conclusion
The incorporation of signals into portfolio construction offers a sophisticated and systematic method for enhancing returns and managing risks. Momentum and economic regime signals are particularly effective in navigating market trends and adapting to macroeconomic shifts. Momentum signals capitalize on the persistence of price movements, while economic regime signals provide a contextual framework for macroeconomic alignment. When combined, these signals facilitate a dynamic portfolio strategy that optimally balances risk and return across various market environments.
For financial advisors and portfolio managers, integrating these signals into the investment process represents a move towards a more adaptive and data-driven approach. Recognizing the inherent risks of these strategies, it is imperative to adopt sound risk management practices to mitigate potential pitfalls. By leveraging signals within a robust framework, investors can construct resilient portfolios capable of navigating complex financial landscapes and achieving their long-term investment objectives.
Ref 1. Data Source: Algo-Chain - 31 Dec 2002 to 31 Oct 2024 in USD.
Disclaimer
*The podcast provided by Allan Lane & Irene Bauer has been converted from their own original content, into a podcast using Generative AI tools and the voices used in the podcast are not their own. All information provided has been fact checked.
The investments referred to in this podcast is targeted at professional Wealth Managers & Financial Advisors and may not be suitable for all investors. Twenty20 Solutions Ltd does not provide, and nothing in this podcast should be construed as, investment or other advice. It is not intended that anything stated in this podcast should be construed as an offer, or invitation to treat, or inducement for you to engage in any investment activity. The information in this podcast relating to model portfolios & individual funds suggested by Algo-Chain is purely for research and educational purposes only.